Spatial Data Analysis to Measure Inequalities
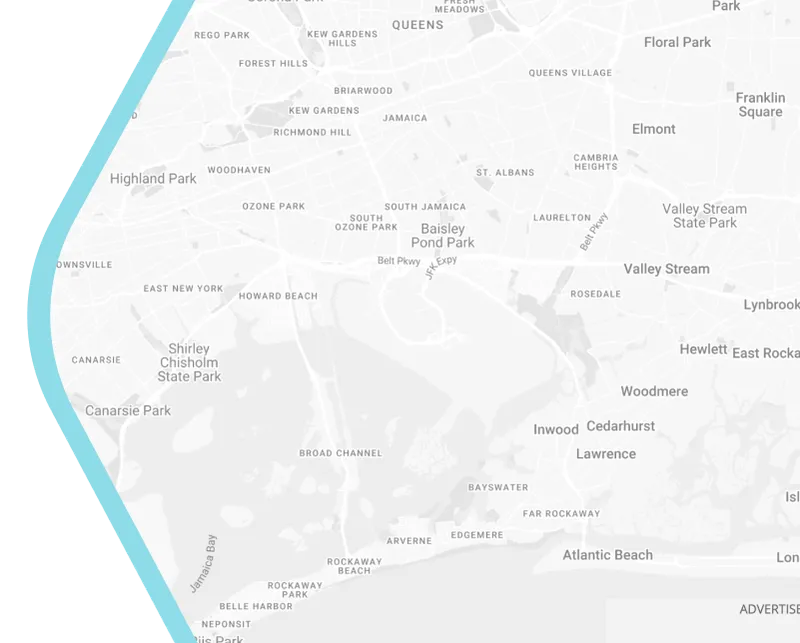
The wide use of smart technology has allowed us to get accurate geographic information of a city or area. The use of spatial data should enhance the analysis of planner and provide evidence on how the city tackles inequalities. Du et al. (2021) take New York City as a case study to introduce a new qualitative methodological approach to assess how urban resource are distributed. The analysis used two sets of data, neighbourhood walkability and neighbourhood amenity.
In the case of New York City, it was found that neighbourhood areas that are disadvantageous are those areas that have limited walkability and mobility options and lack of public amenities such as grocery stores and green spaces. The elderly and female population were groups that were mostly affected by the inequalities of urban resources. With this method, not only could we gather the evidence of spatial inequalities in cities but also could help the local government create better strategic planning that addresses the concern. Du et al. (2021) also suggest that policies concerning the inequality of distribution of urban services such as public transport and walkability design should be incorporated further in the sustainable development plan.
Reference:
Du, M., Zhang, X., & Mora, L. (2021). Strategic planning for smart city development: assessing spatial inequalities in the basic service provision of metropolitan cities. Journal of Urban Technology, 28(1-2), 115-134.
